Wage Inequality is Surging in Largest U.S. Cities
Bureau of Labor Statistics report finds San Jose, Washington and Houston among cities with biggest gaps.
From the Occupy Movement to the election of New York City Mayor Bill de Blasio to the publication of Thomas Piketty’s Capital in the Twenty-First Century, rising economic inequality has in recent years registered as one of America’s leading social and political issues, especially in cities. And the numbers back this up: Income inequality is indeed higher in many U.S. metros than the nation as a whole.
According to a study from the Bureau of Labor Statistics, wage inequality has surged across America’s leading metros as well. Wage inequality, which here measures the gap between high- and low-earning workers, is different from income inequality, since incomes also include investments, royalties, and rents, as well as wages. Measures of income inequality also include the poor who do not work and those who are out of the workforce. My own research has shown a stunning gap in wage inequality, especially in America’s leading tech hubs, with their huge concentrations of high-paid tech workers and the creative class.
The BLS report uses data from the Occupational Employment Statistics program to identify the gap between the very highest- and lowest-wage earners according to a so-called 90-10 ratio, which compares the earnings of the top 90 percent of wage earners to that of the bottom 10 percent. Across the nation, the gap was nearly five times, with the highest 90 percent of earners taking home $88,330 on average per year, while those in the lowest 10 percent make $18,190 on average. The BLS then examined the 90-10 wage inequality across America’s 395 metro areas.
My Martin Prosperity Institute colleague Charlotta Mellander grouped the BLS data to fit the broader geographies for consolidated metro areas, so smaller metros like Bethesda, Maryland, become part of the broader consolidated Washington metro.
The geography of wage inequality
The map below, from MPI’s Isabel Ritchie, shows the extreme variation in this 90-10 ratio for wage inequality across U.S. metros. On the map, the dark purple color represents the metros with the largest ratios and the most wage inequality, while the light blue color reflects the areas with the smallest ratios and the least wage inequality.
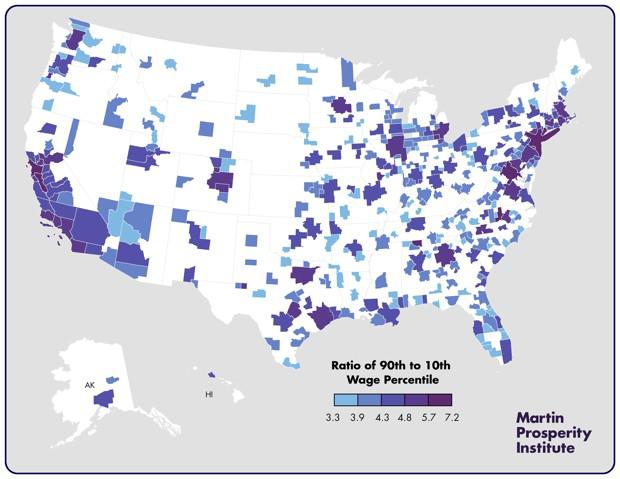
Check out the extreme bicoastal pattern. The 90-10 ratio is greatest along the Boston-New York-Washington corridor on the East Coast, and around the Bay Area, Los Angeles, and the Pacific Northwest near Seattle and Portland.
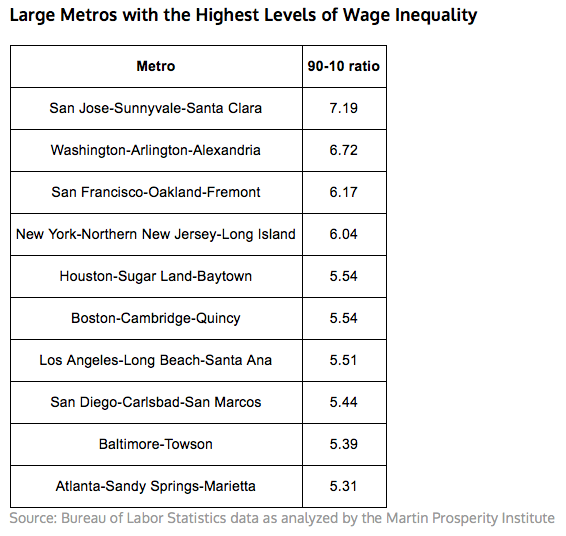
The table below lists the 10 metros with the highest levels of wage inequality. The metro with the highest 90-10 ratio is San Jose, where the top 10 percent of workers on average make up more than seven times the bottom 10 percent. Nearby San Francisco and Oakland also make the top 10. On the East Coast, Washington has the second highest level of 90-10 wage inequality, followed by New York City in fourth. Houston is fifth. If we include the smaller metros, the tech hubs of Huntsville, Alabama; Durham-Chapel Hill, North Carolina; and Boulder, Colorado, all join the top 10.
Characteristics of metros with high inequality
But this raises the question: What factors and what kinds of metros are associated with higher levels of 90-10 wage inequality? To get at this, Mellander ran a basic correlation analysis of the key demographic, social, and economic characteristics of metros that might be associated with 90-10 wage inequality. As usual, we remind readers that correlations like these do not imply causation but only point to associations between variables.
First off, wage inequality is closely associated with knowledge-based, high-tech metros. The BLS report finds it to be related to knowledge-based occupations spanning fields such as computer science and math, engineering, business and management, arts, design, media, and entertainment. And, according to our correlation analysis, wage inequality is closely associated with high-tech industry (with a correlation of .72), the creative class (.73), and college grads (.62). It is also closely related to the share of workers in science and technology occupations (.71) and in business and management occupations (.65), but less so with arts, culture, and entertainment workers (.48). Conversely, we find a negative correlation between wage inequality and the working class (-.43).
Ironically, metros with higher levels of 90-10 wage inequality also have high wages across the board (with a correlation of .88). More troublingly, wage inequality appears to be bound up with higher housing costs, being closely correlated with the share of income devoted to housing (.67). The higher wage earners in knowledge-based metros essentially bid up the cost of housing. And while knowledge workers and the creative class make enough to cope with the increased costs, as my own research has shown, this hits extremely hard at workers in lower-paid service and blue-collar jobs who increasingly cannot afford to live in these places.
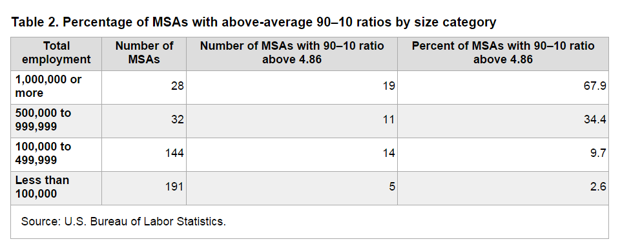
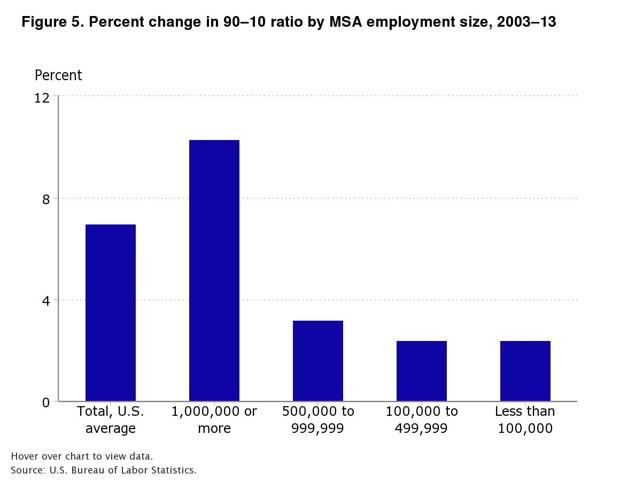
Wage inequality is also higher in larger, denser metros. As the table above from the report shows, nearly 70 percent of metros with more than one million people have a high level of 90-10 wage inequality. This compares to 34.4 percent for metros with between 500,000 and one million people, roughly 10 percent for metros with between 100,000 and 500,000 people, and less than three percent for metros with less than 100,000 people. Large metros also saw the biggest increases in wage inequality, as shown on the table below. These results are in line with research by my University of Toronto colleague Nate Baum-Snow, who—along with Ronni Pavan—found that metro size accounted for 25-35 percent of the increase in economic inequality across U.S. metros from 1979-2007.
Our analysis finds close correlations between wage inequality and both population size (.61) and density (.62). Wage inequality is also associated with the share of commuters who use public transportation (.58)—another proxy for density—and negatively associated with the share who drive to work alone, a proxy for sprawl (-.44).
Our future challenge
Wage inequality is not just a bug of our new, clustered urban geography—it is a fundamental feature of it. More specifically, this inequality is a product of dense, knowledge-based cities and regions, which essentially split the workforce into a smaller group of well-paid knowledge and professional workers and a much larger group of lower paid service and blue-collar workers. This same intense urban clustering of the advantaged class also drives up housing costs, pushing the less advantaged even further behind. Ultimately, wage inequality appears to be baked into the spiky geography of the innovative knowledge economy.
Still, it makes little sense to try cope with it by somehow limiting the returns and wages of high-earning knowledge jobs clusters, which generate the innovations and start-ups that power growth. Just as we once stoked the furnace of industrialization by upgrading manufacturing jobs into middle-class jobs, the challenge today is not to contain the growth of high-paying jobs or high-earning places. It’s to develop strategies to increase the earnings of low-paid service workers and upgrade their occupations.